


📹 Product Demo
Peak Fromation Dashboard Pro
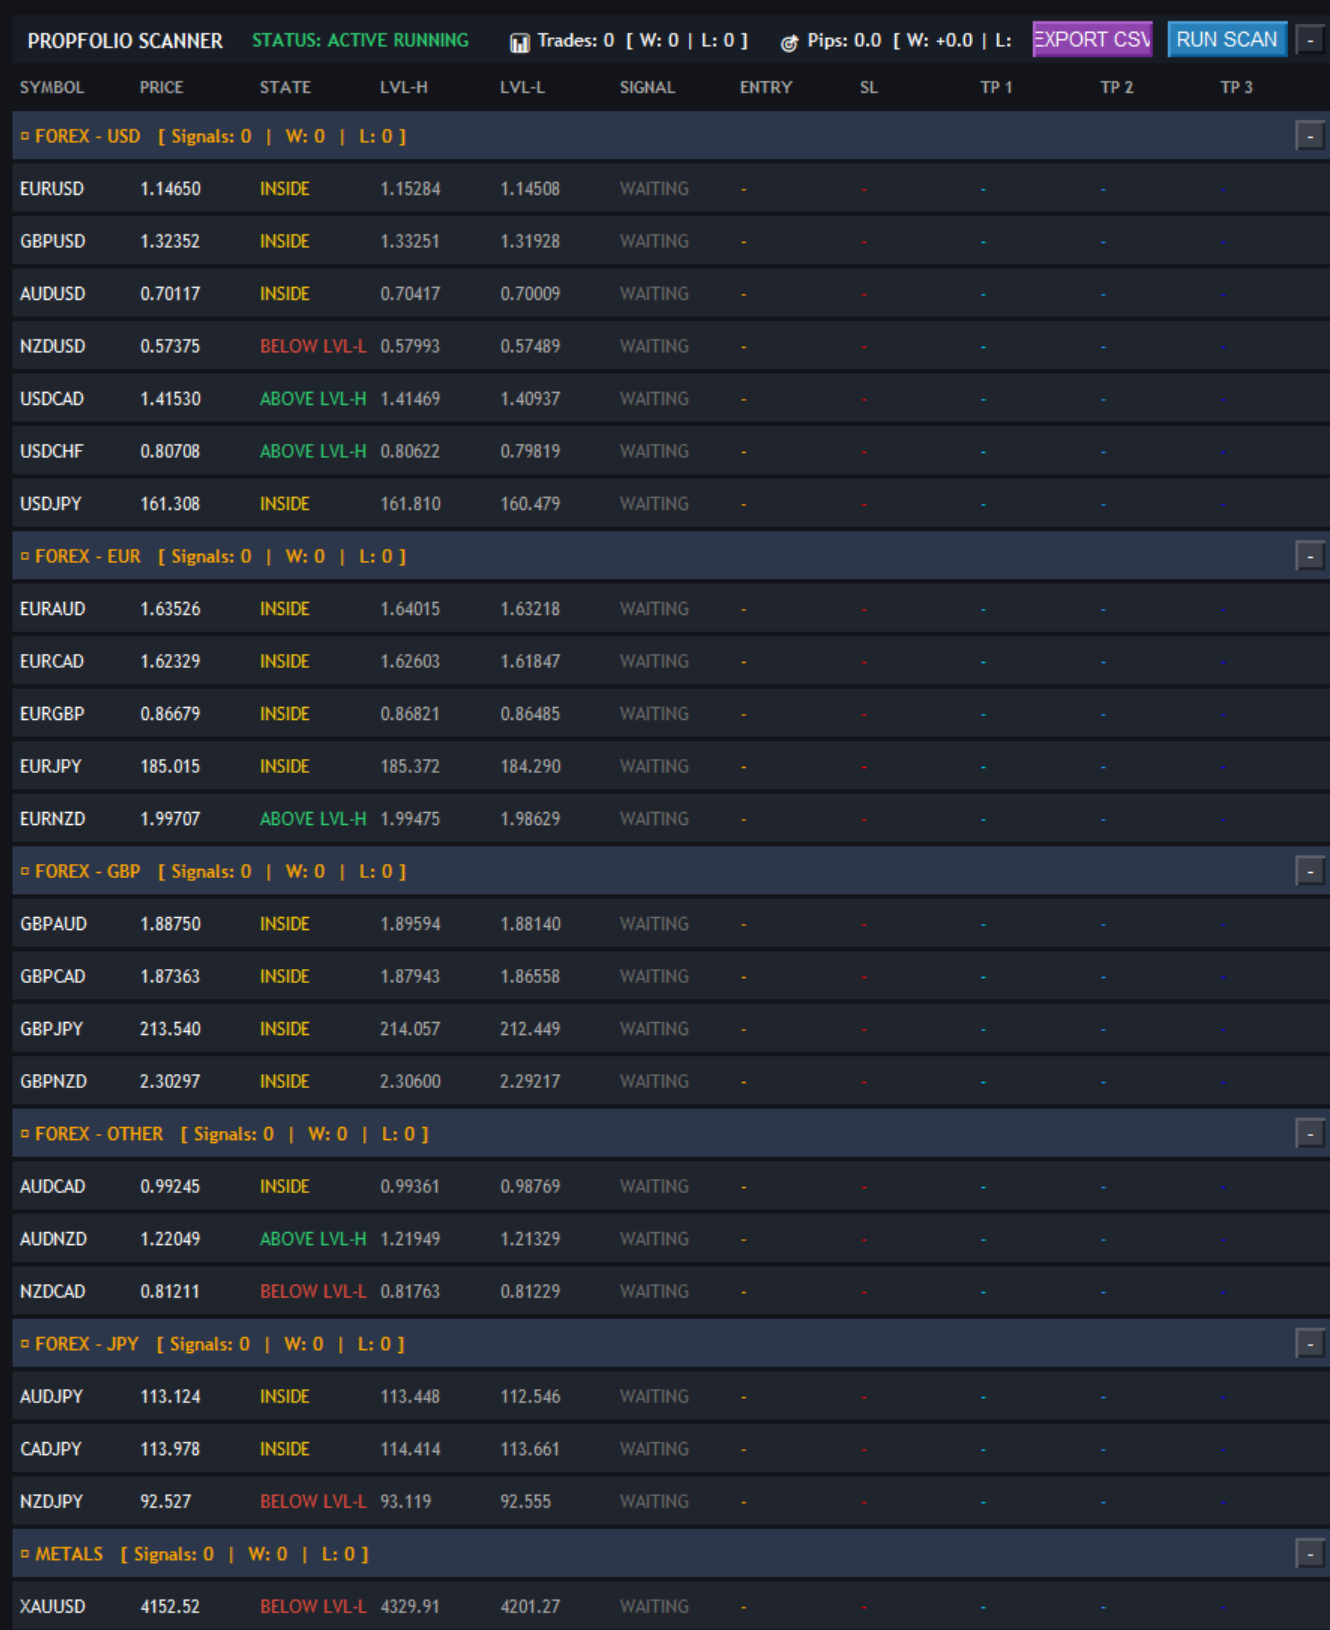
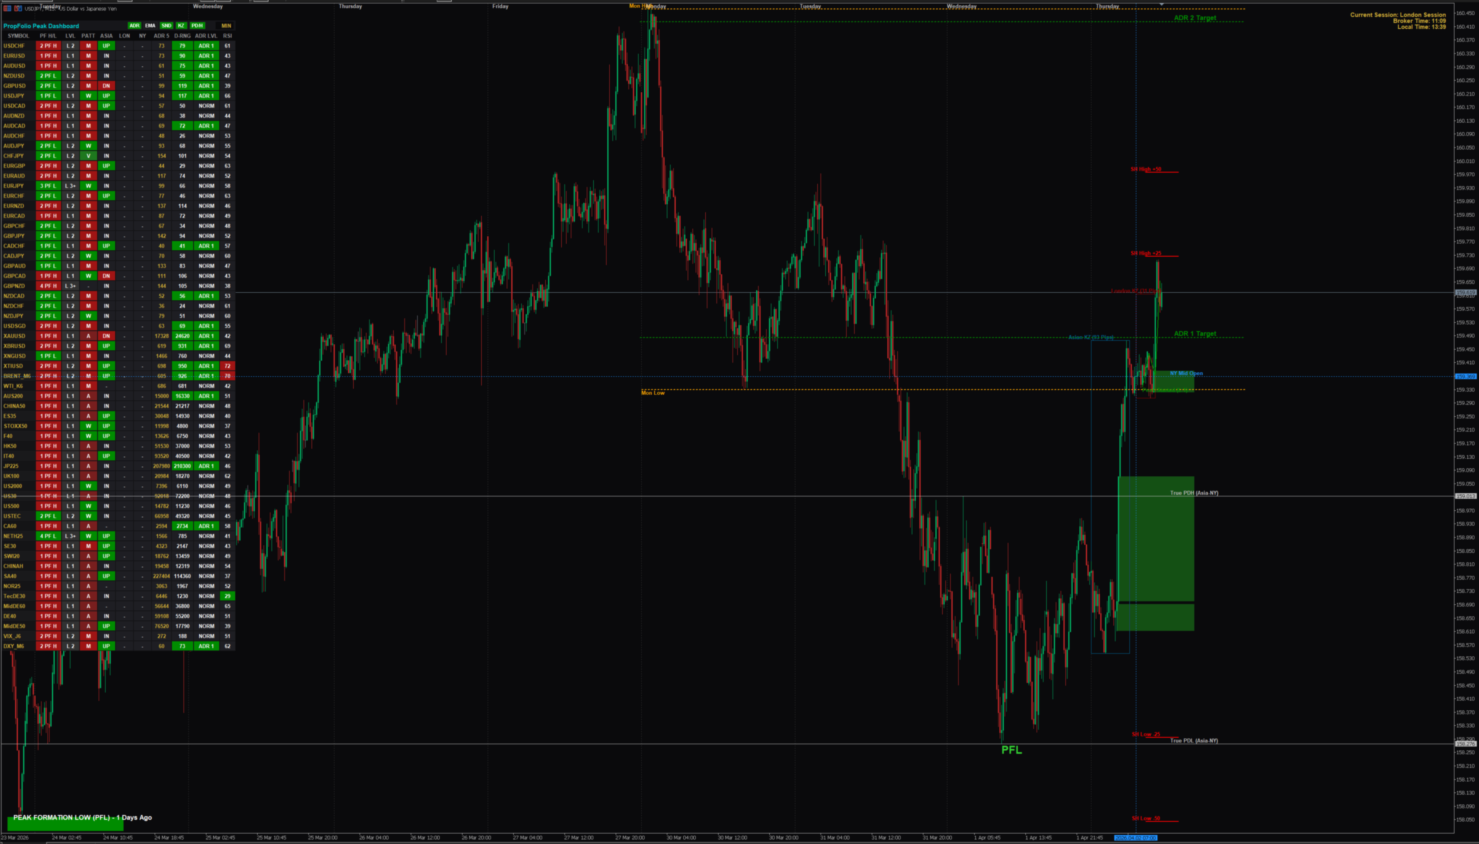
Peak Formation Dashboard Pro( Light and Dark Theme Option ) Multi-Pair Scanner: Tracks your entire Market Watch or a custom list of pairs in real-time. Light and Dark Theme Option Draggable & Minimizable UI: Keep your chart clean. Drag the dashboard anywhere on your screen, or minimize it to a single button. Quick-Toggles: Click the header buttons (ADR, EMA, SND, KZ, PD/H) to instantly show or hide specific chart elements without opening the settings menu. At-a-Glance Metrics: Instantly see the Peak Formation status, BTMM Cycle Level, Active Patterns (M, W, A, V), Session Trends (Asia/London/NY), ADR vs. Daily Range exhaustion, and RSI. BTMM & Peak Formation Tracking Auto Peak Detection: Automatically identifies True Peak Formation Highs (PFH) and Lows (PFL) and labels them clearly on the chart. Days in Cycle: The dashboard tracks exactly how many days the market has been moving away from the peak, helping you pinpoint Level 1, 2, and 3 consolidations and reversals. M & W Patterns: Automatically draws visual trendlines over structural M (Double Top) and W (Double Bottom) patterns originating from peaks. BTMM EMAs: Includes the standard BTMM EMA stack (5, 13, 50, 200, 800). Advanced Volume Profile Dual Modes: Choose between Fixed Daily Volume Profile or a fully Flexible, draggable profile. POC & Value Areas: Automatically calculates and draws the Point of Control (POC), Value Area High (VAH), and Value Area Low (VAL) covering 70% of the volume. Interactive Dragging: In Flexible mode, simply drag the vertical start/end lines, and the volume profile updates instantly in real-time. Sessions, Killzones & Stop Hunts Institutional Killzones: Auto-draws color-coded boxes for the Asian Range, London Open, NY Open, and London Close. Asian Stop Hunts: Projects exact +25 and +50 pip Stop Hunt boxes above and below the Asian Range to catch Market Maker traps. True Time Engine: Displays Broker Time, Local Time, and the active session directly on the chart. NY Midnight Open: Auto-plots the True New York Midnight opening price line. Macro Levels & Support/Resistance Supply & Demand (SND): Scans historical price action to draw fresh, unmitigated Supply and Demand zones based on momentum candle bodies. True PDH & PDL: Plots the True Previous Daily High and Low based strictly on the Asia-to-NY cycle, not just the broker's midnight candle. Monday Range: Extends Monday's High and Low across the entire week as major structural pivot points. ADR Projections: Draws advanced Average Daily Range exhaustion targets (ADR 1, ADR 2, ADR 3) projecting outward from the current daily extremes Real Time alerts - On all Events New Peak Formed , Level Reached , Patern Found . TDI alerts Popup alerts Telegram Alerts With Screenshot Push Notification Gann Zones - Real Time Zones
Choose License
📋 Setup Instructions
Open MT4 Terninal- Ople Data Folger > MQL >Indicators> copy & paste .ex4 file
Restart Terminal-
Add Indicator to Chart in input Settings Add Licecne key - Licence Ky is available in your Dashbaord.